
Loading...
Centrality-Based Exploration of Network Topologies from Regulatory Assemblies
Network View

What is CENTRA?
CENTRA (Centrality-based Exploration of Network Topologies from Regulatory Assemblies) is a web-based application designed to support hypothesis generation about gene and protein function by analyzing their topological positioning within topic-specific biological networks.
These networks were constructed from gene sets reported in thousands of publications, which were systematically categorized into 27 distinct biomedical topics.
By combining functional enrichment of network modules with topological analysis of individual nodes, CENTRA enables users to assess the relative importance and potential roles of genes or proteins within specific biological contexts.
From Thousands of Publications to Biological Topics
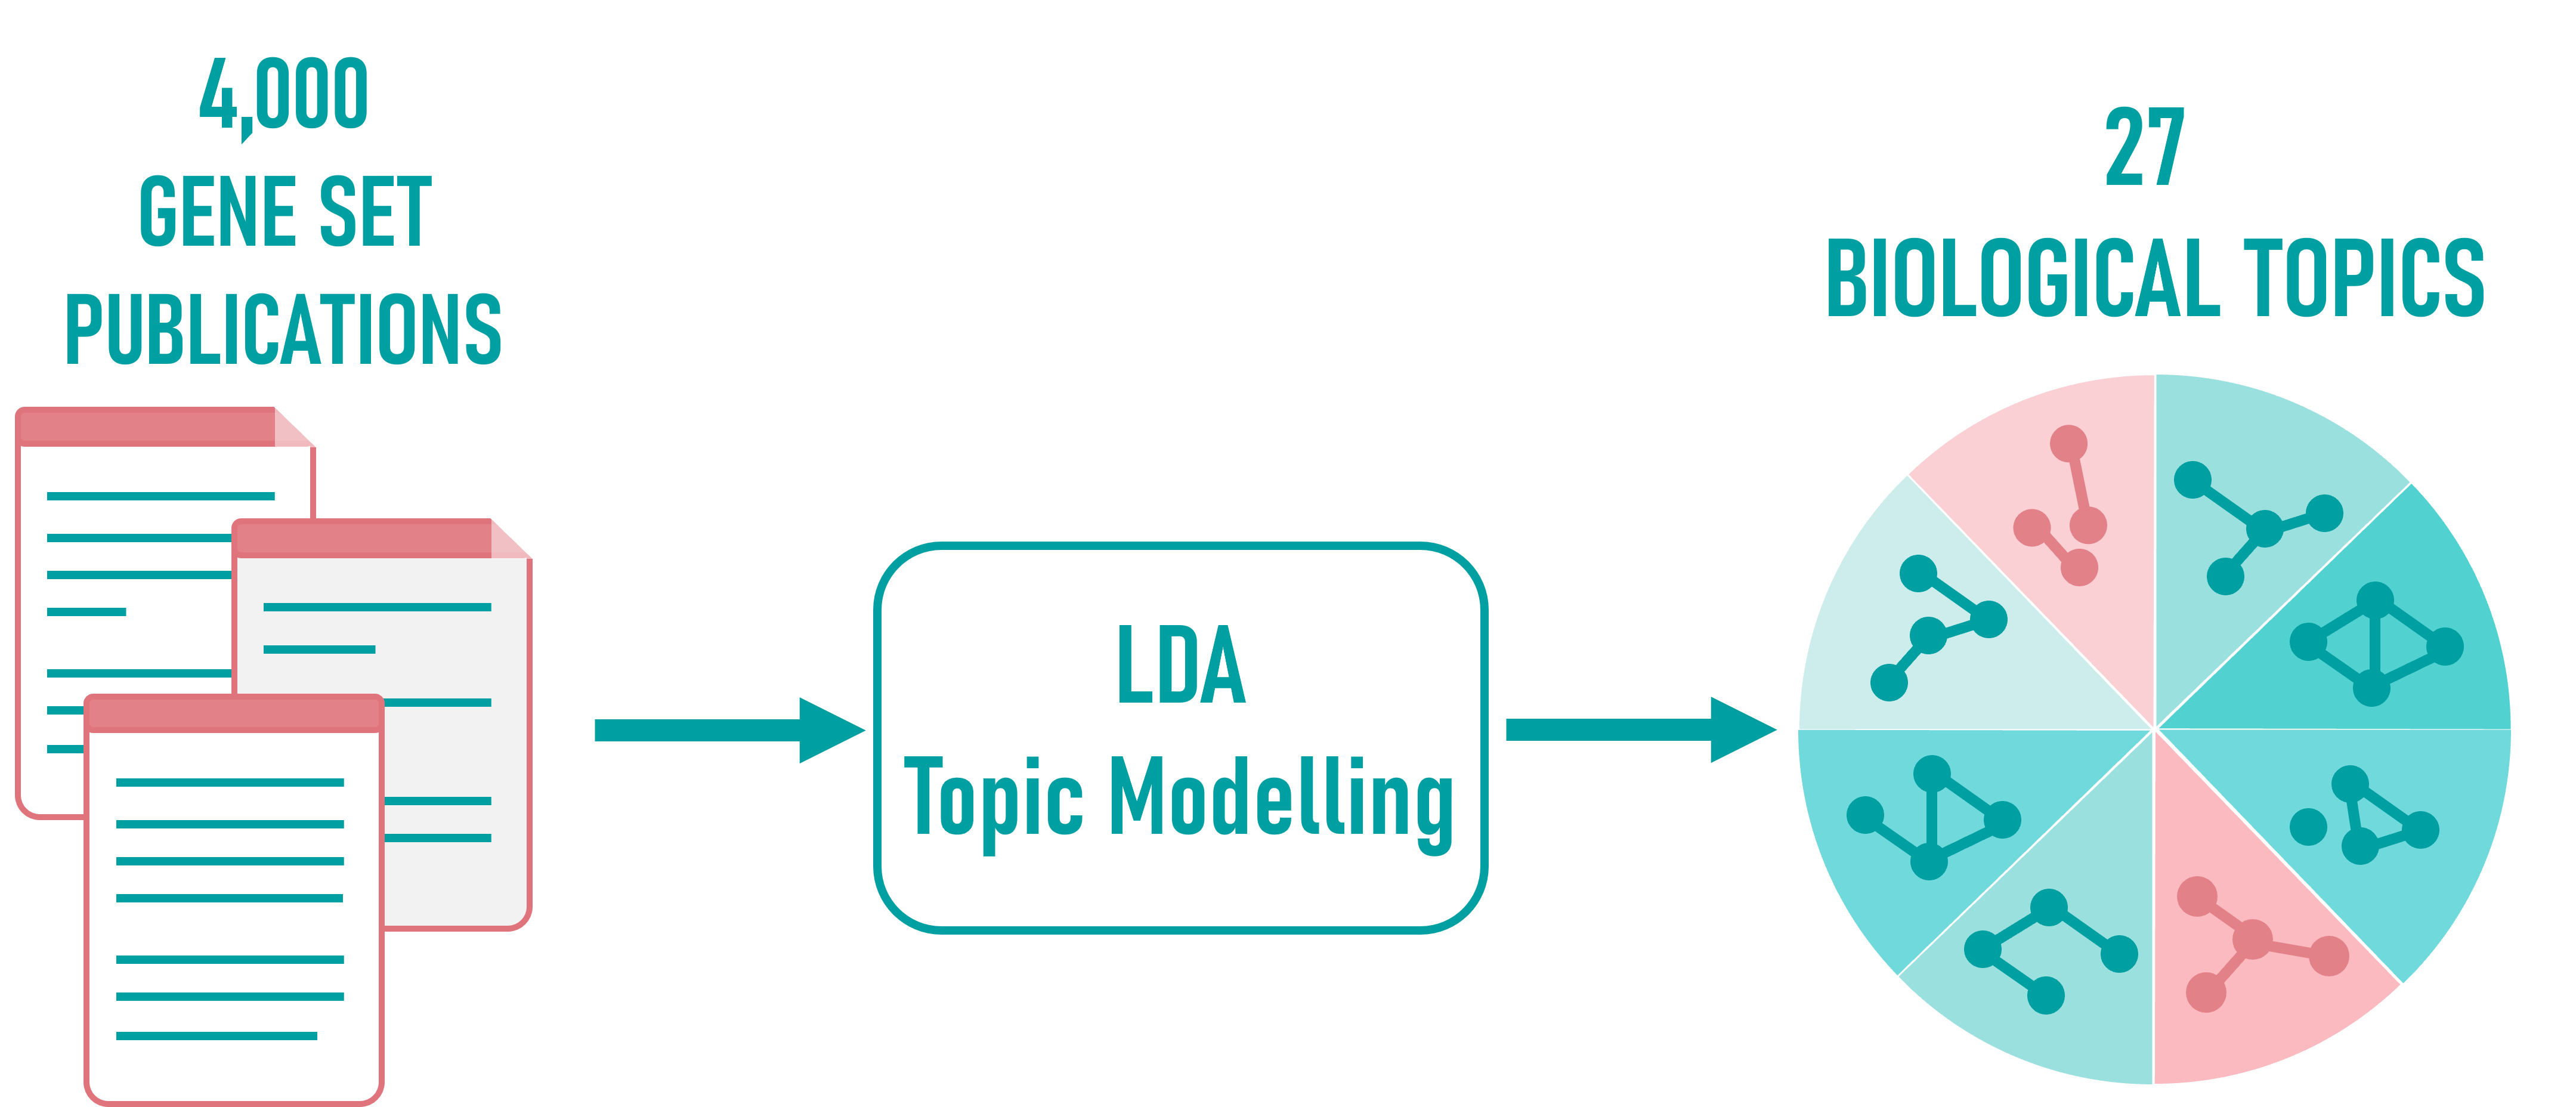
CENTRA draws from over 4,000 gene set publications, each describing curated gene lists linked to specific biological functions, processes, or disease contexts.
These gene sets were subjected to Latent Dirichlet Allocation (LDA) topic modeling, a machine learning technique that uncovers shared themes across documents.
The result is a set of 27 biological topics, each representing a coherent group of semantically and functionally related gene sets. These topics form the structural backbone of further network construction.
Building Topic-Specific Networks from Gene Set Overlaps
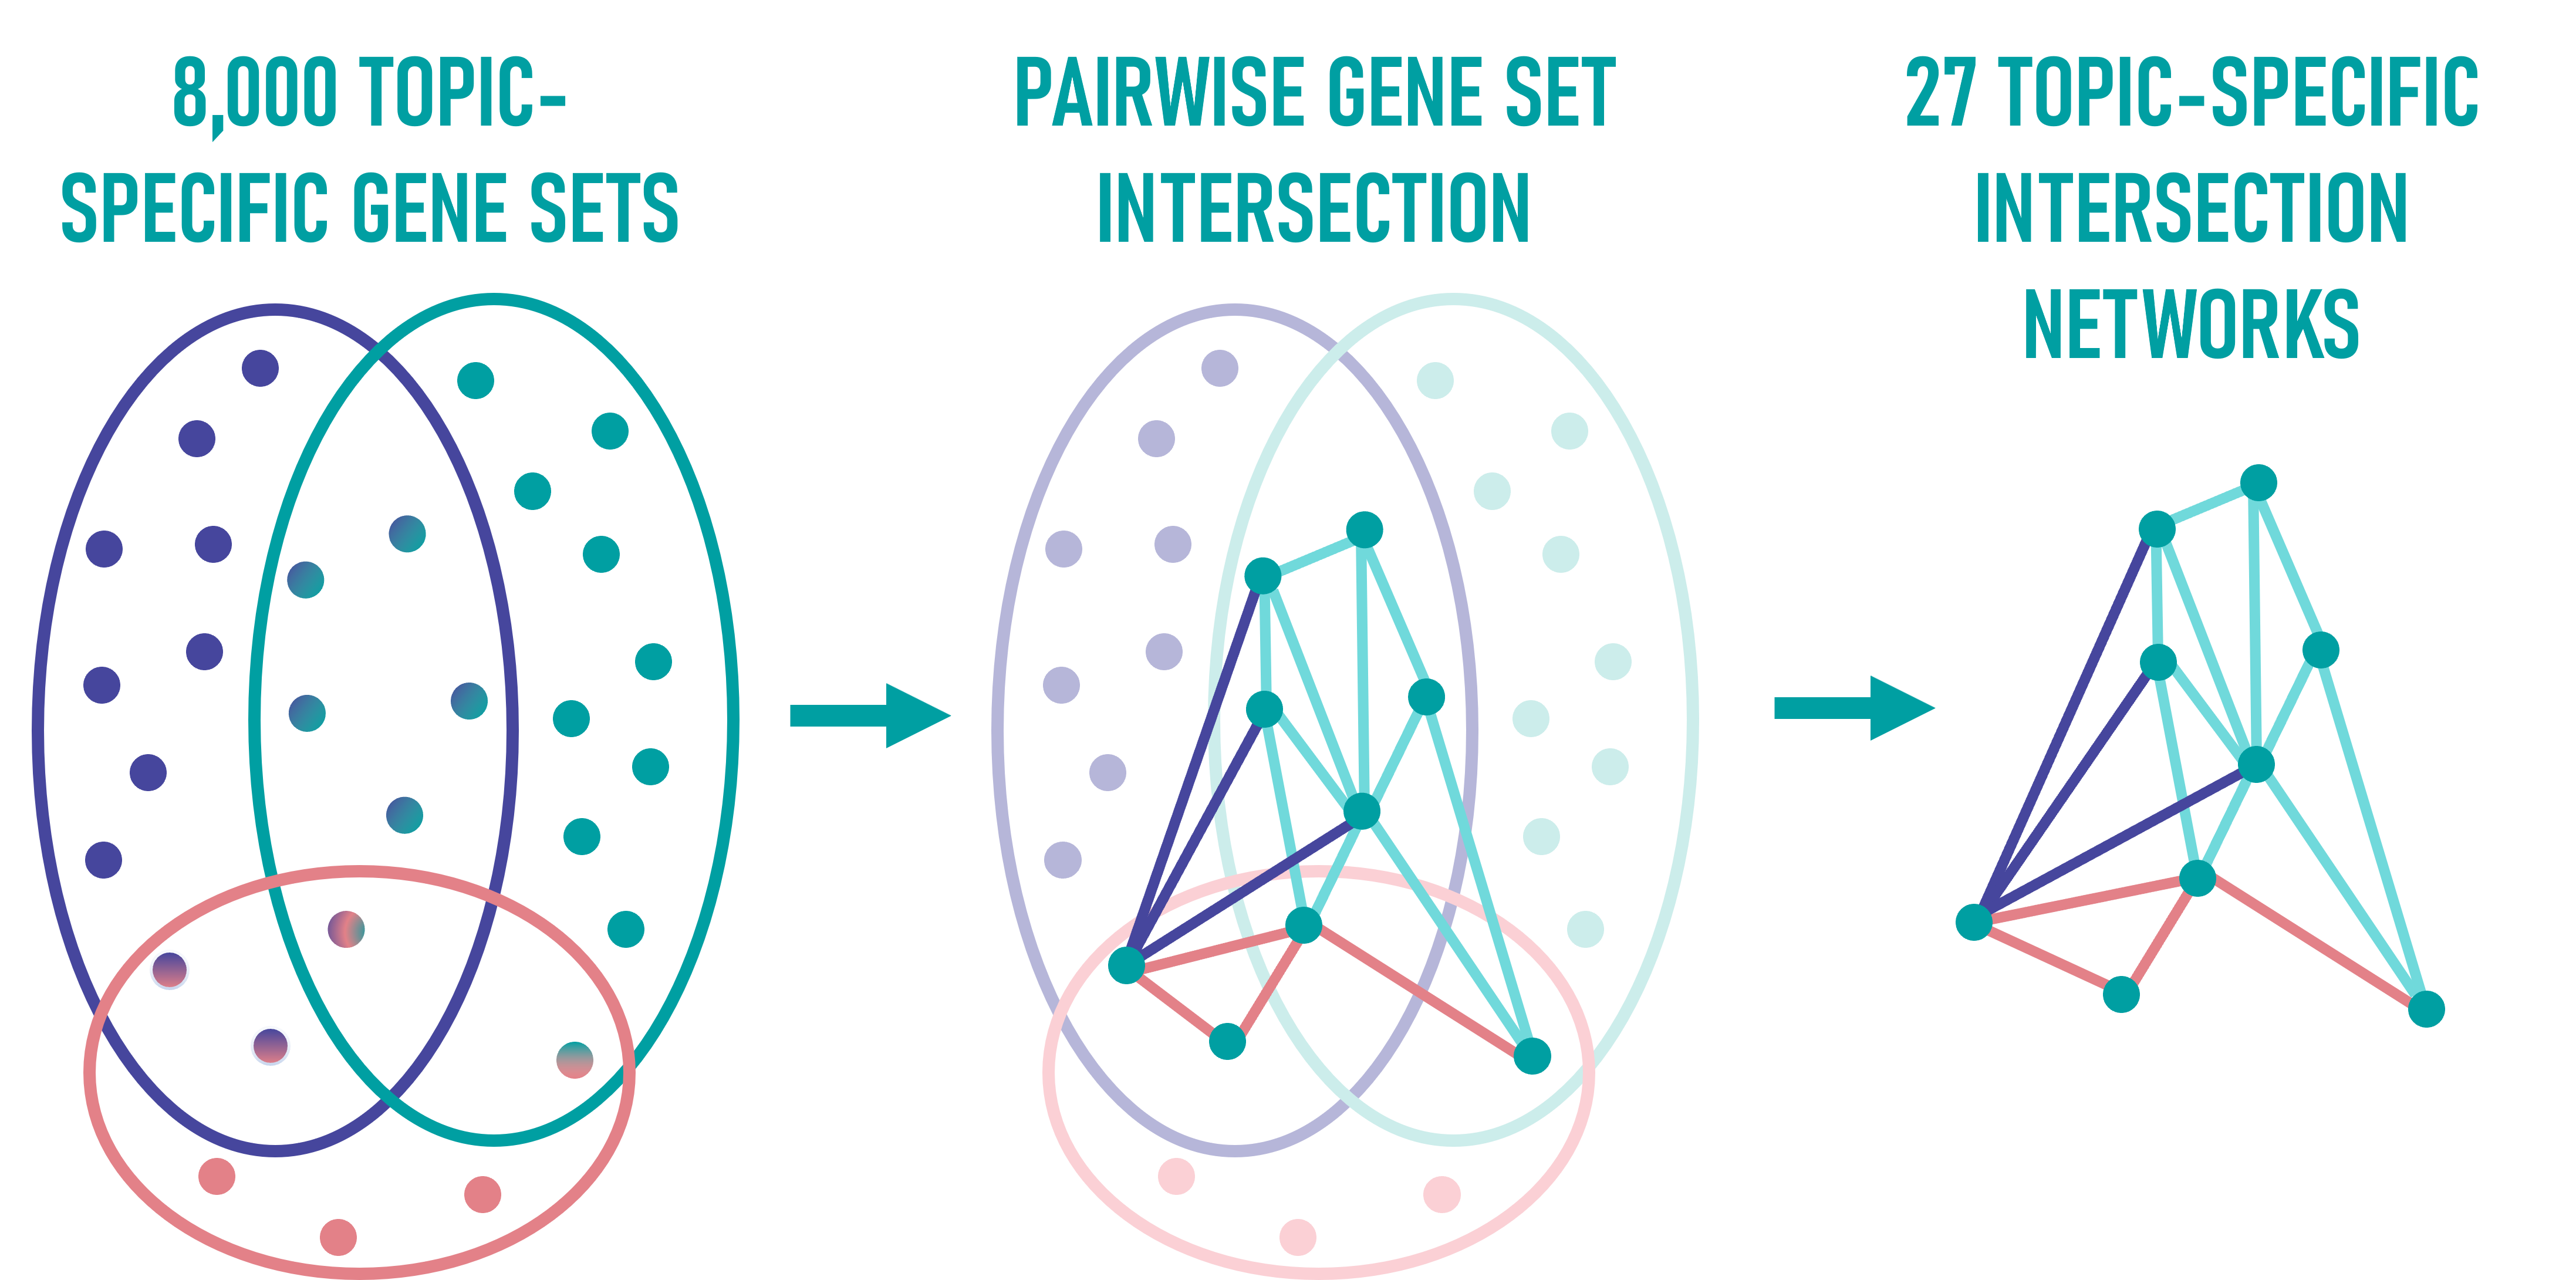
After assigning gene sets to topics using LDA, CENTRA performs pairwise intersection analysis within each topic to quantify how gene sets overlap.
These overlaps are used to create intersection networks, where each node represents an element of a gene set and each edge reflects the co-occurrence of elements across different sets.
This results in 27 topic-specific networks, each capturing the inner structure and functional relation of gene sets within its topic (see Network View).
Functional and Topological Analysis of Modules and Nodes
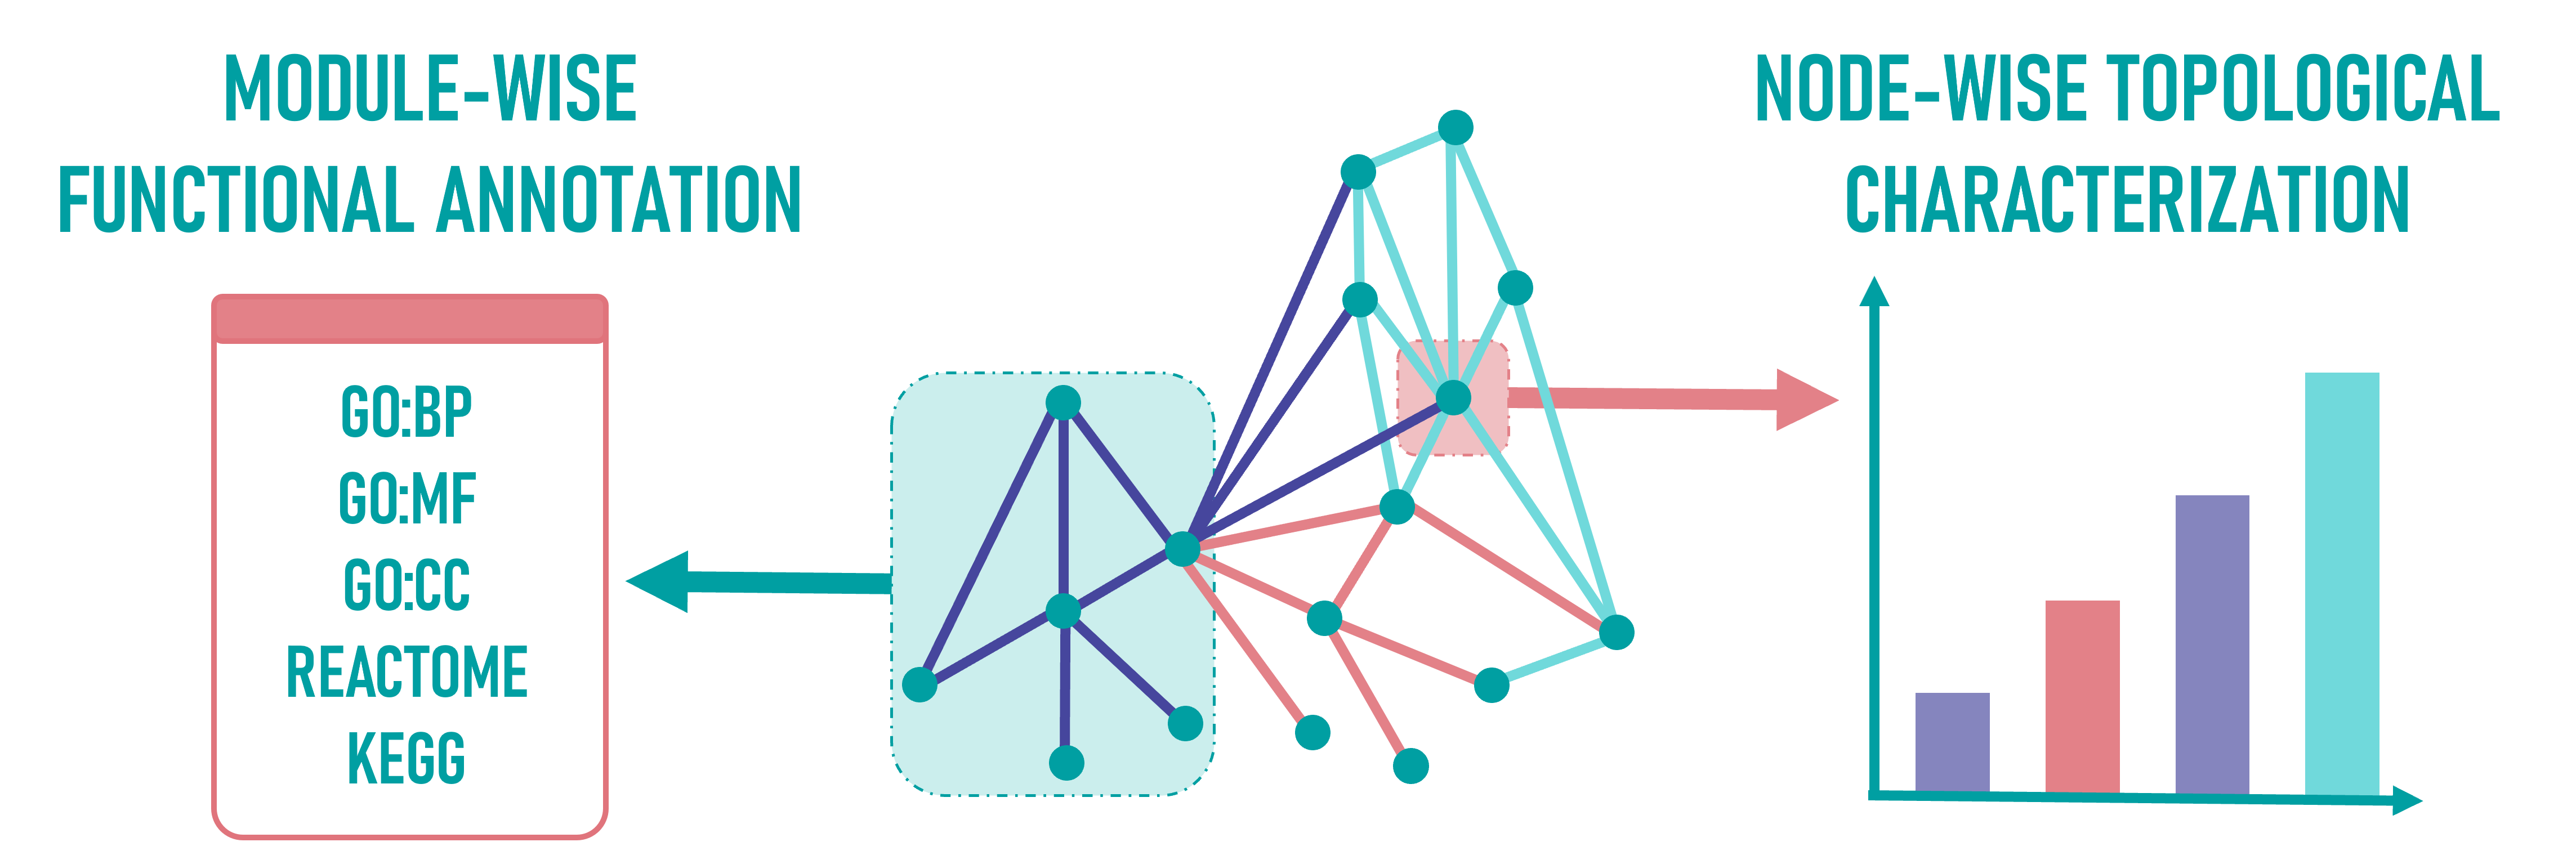
Within each topic-specific network, modules are identified—groups of densely connected nodes.
Each module undergoes functional enrichment analysis with terms from Gene Ontology (Biological Processes [GO:BP], Molecular Function [GO:MF], and Cellular Compartment [GO:CC], Reactome, and KEGG to uncover associated biological processes (see Enrichment Results).
In parallel, each node is characterized topologically based on centrality and complexity metrics, revealing its potential regulatory role and importance within the network.
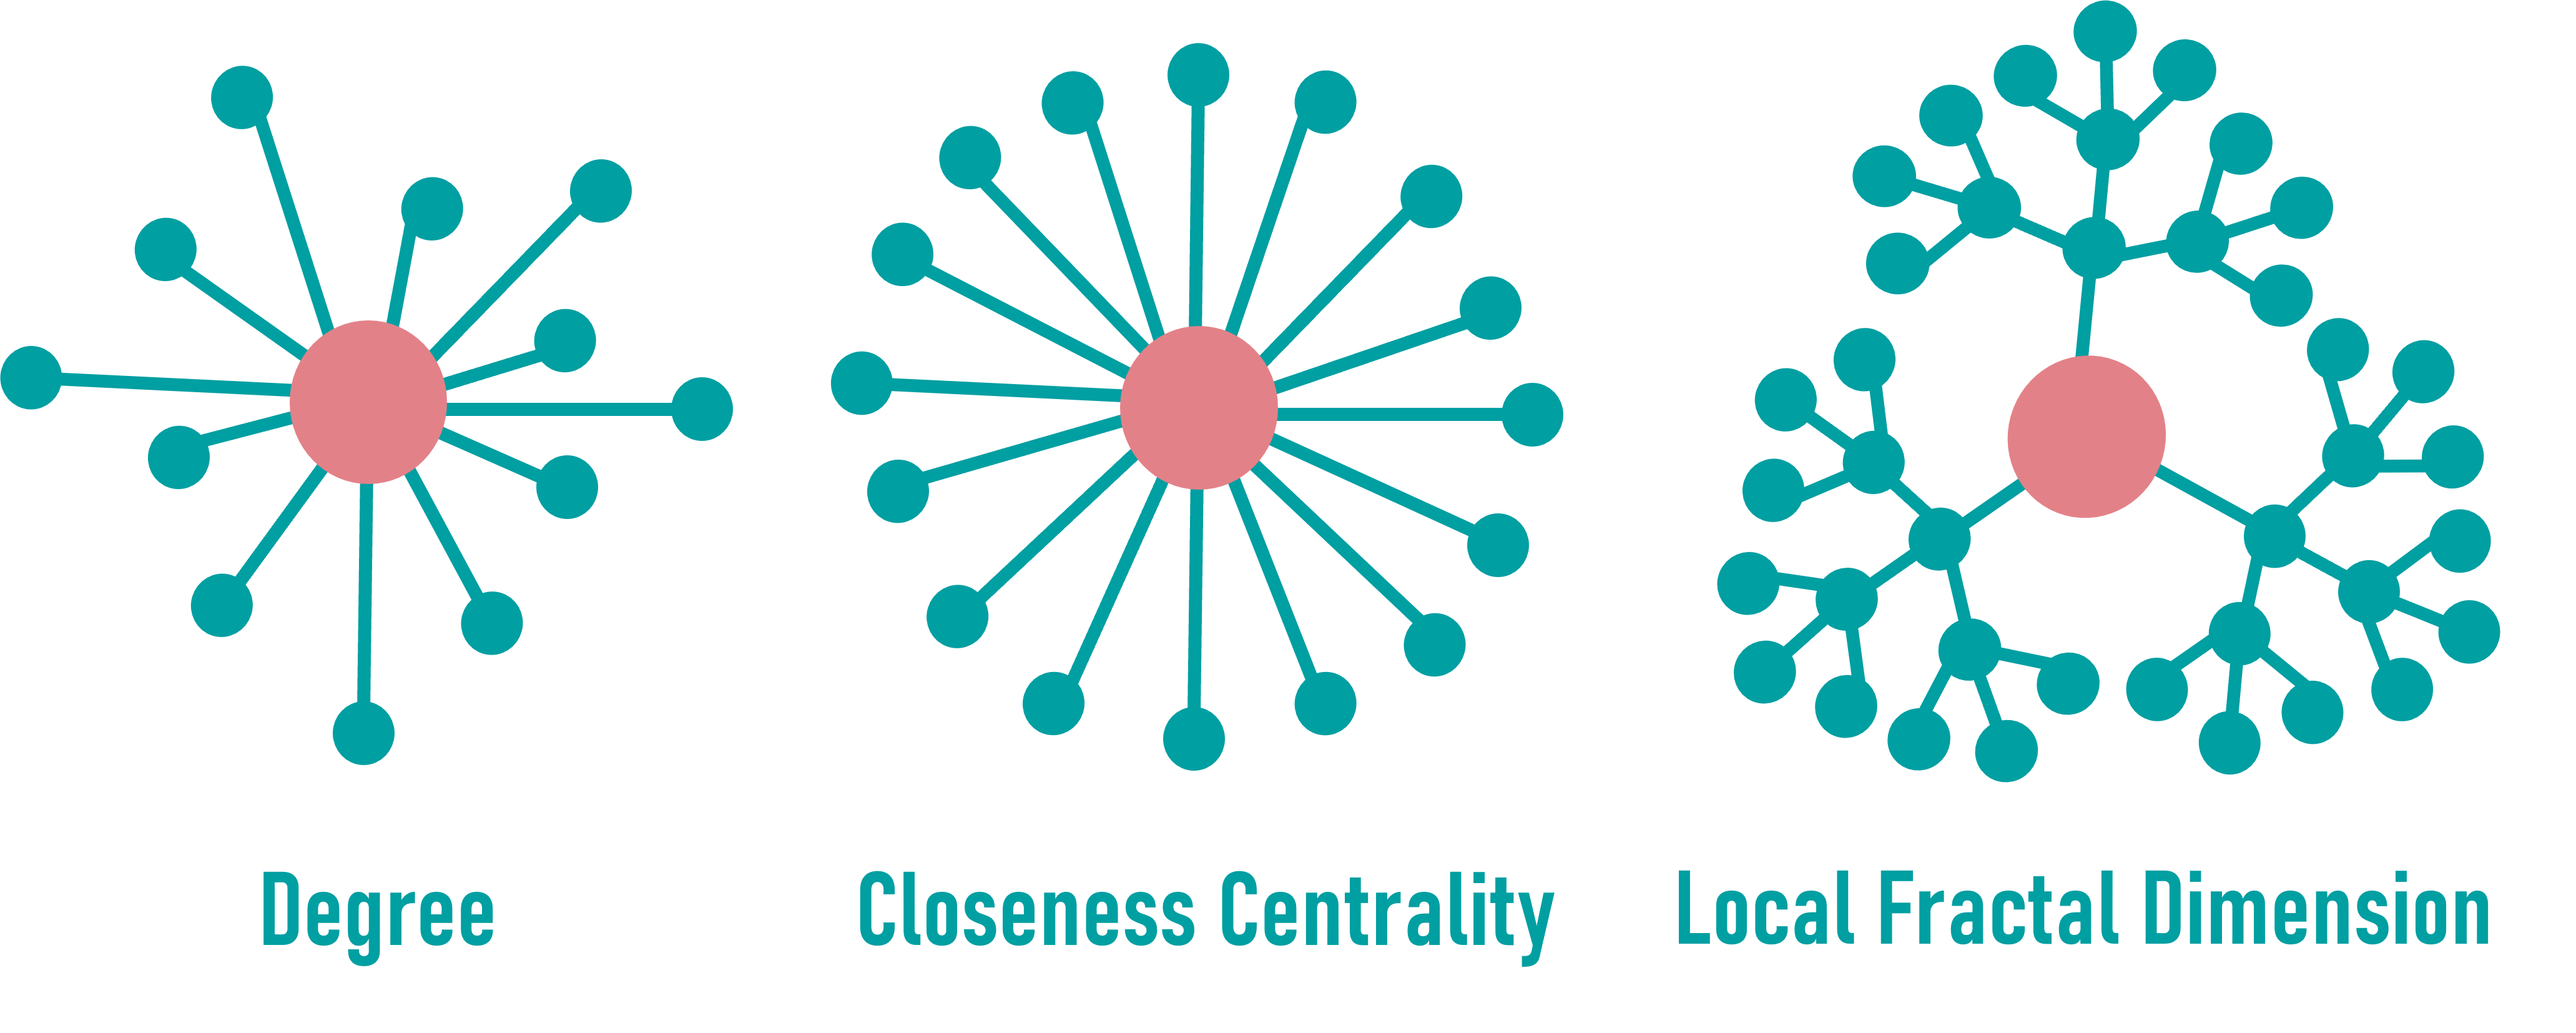
Degree (see tabular data)
Indicates how many direct neighbors a node has.
High-degree nodes may act as local hubs and are potential key players in the network.
Closeness Centrality (see tabular data)
Measures how close a node is to all others in the graph.
A high value suggests fast access or signal spread across the network.
Local Fractal Dimension
Describes how complex and dense the local neighborhood is.
Hierarchical influence or structural integration can be assumed.
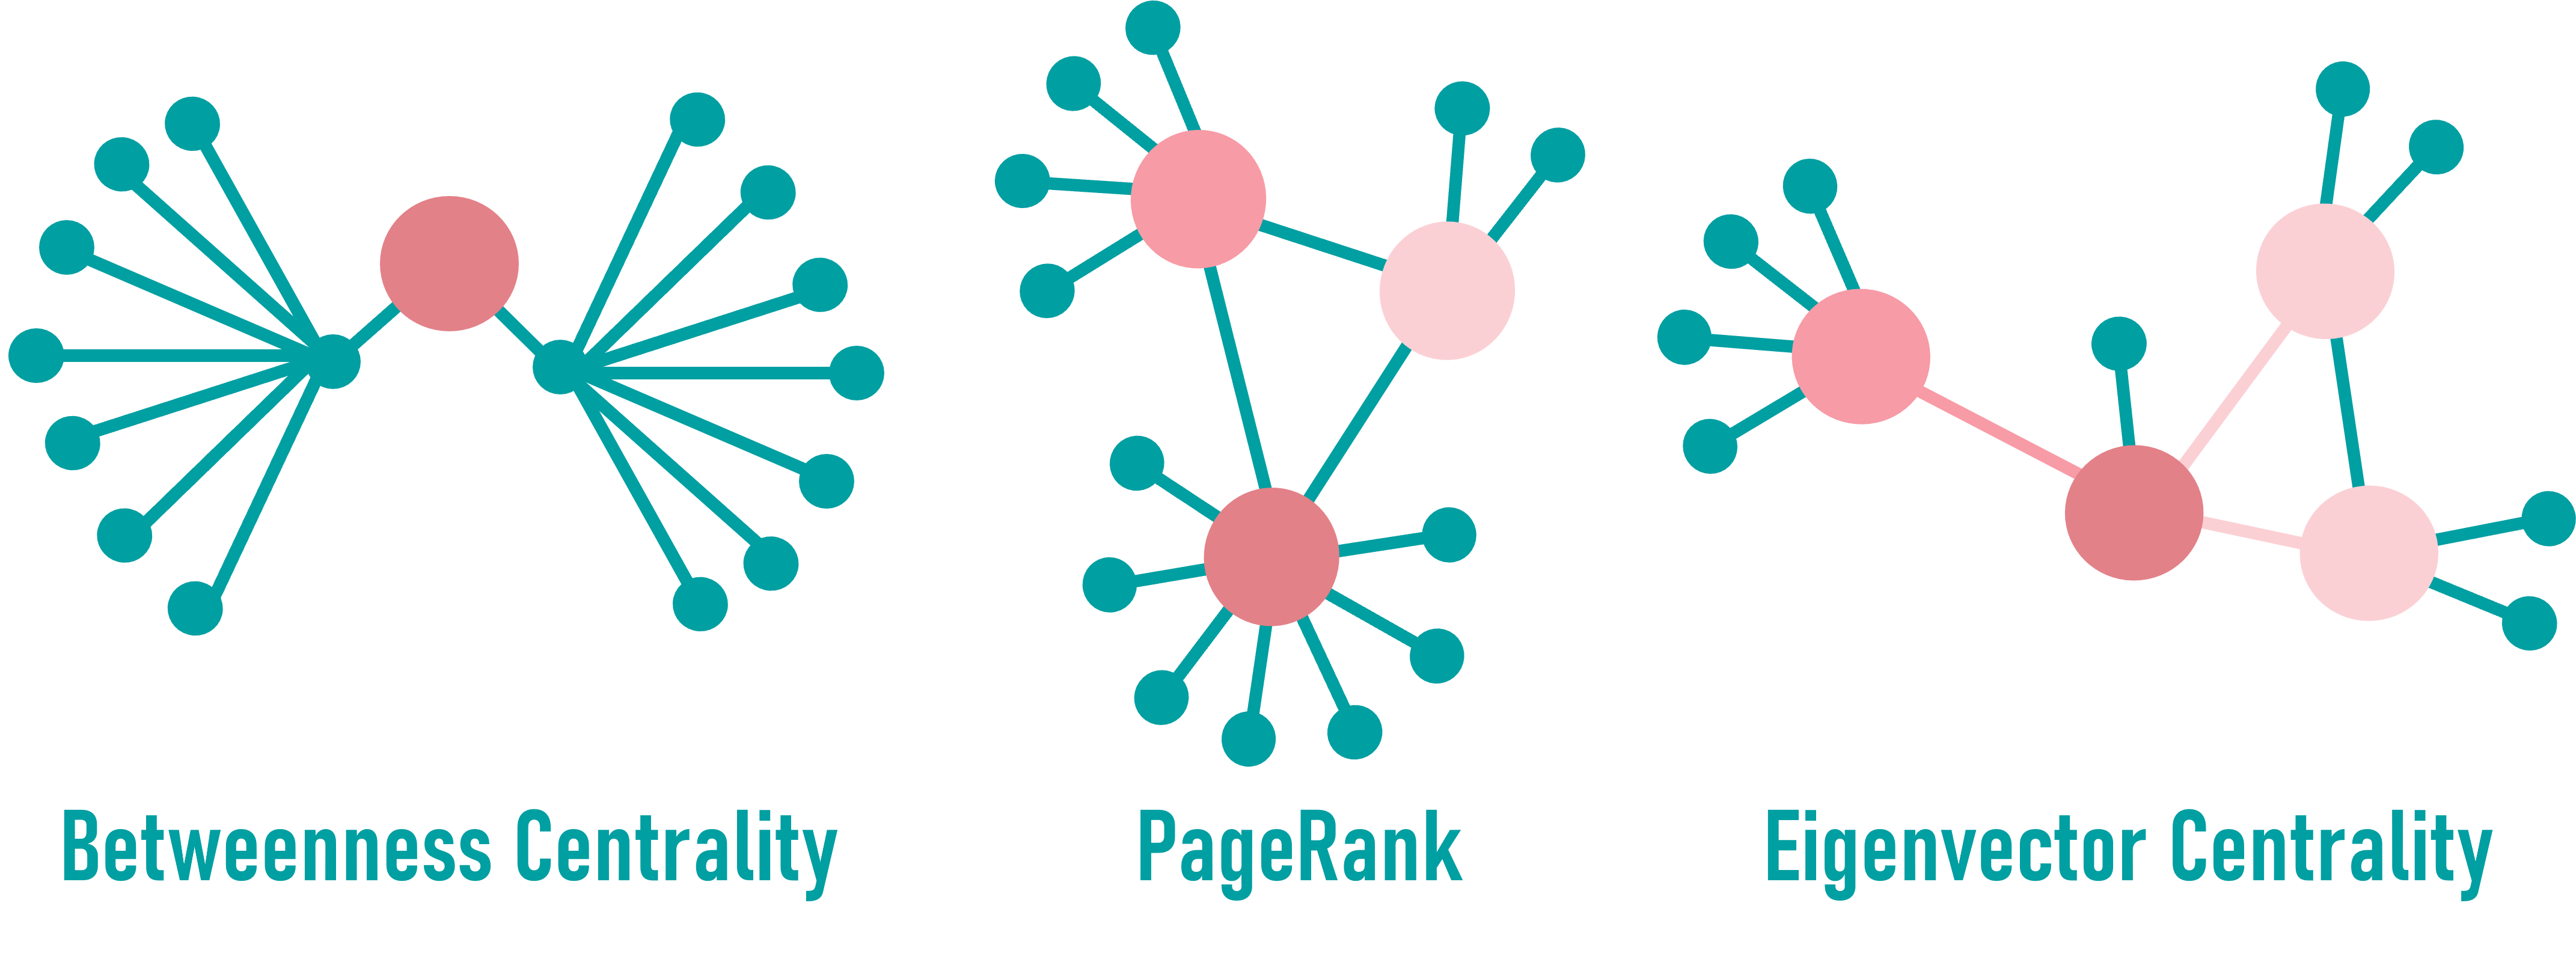
Betweenness Centrality
Measures how often a node lies on the shortest paths between other nodes.
Nodes with high betweenness can act as bottlenecks or bridges for information flow.
PageRank (see tabular data)
Assigns importance to a node based on how connected its neighbors are.
A high PageRank implies influence through indirect connections.
Eigenvector Centrality
Reflects a node’s influence by also considering the importance of its neighbors.
High values suggest a node is embedded in highly influential subnetworks.
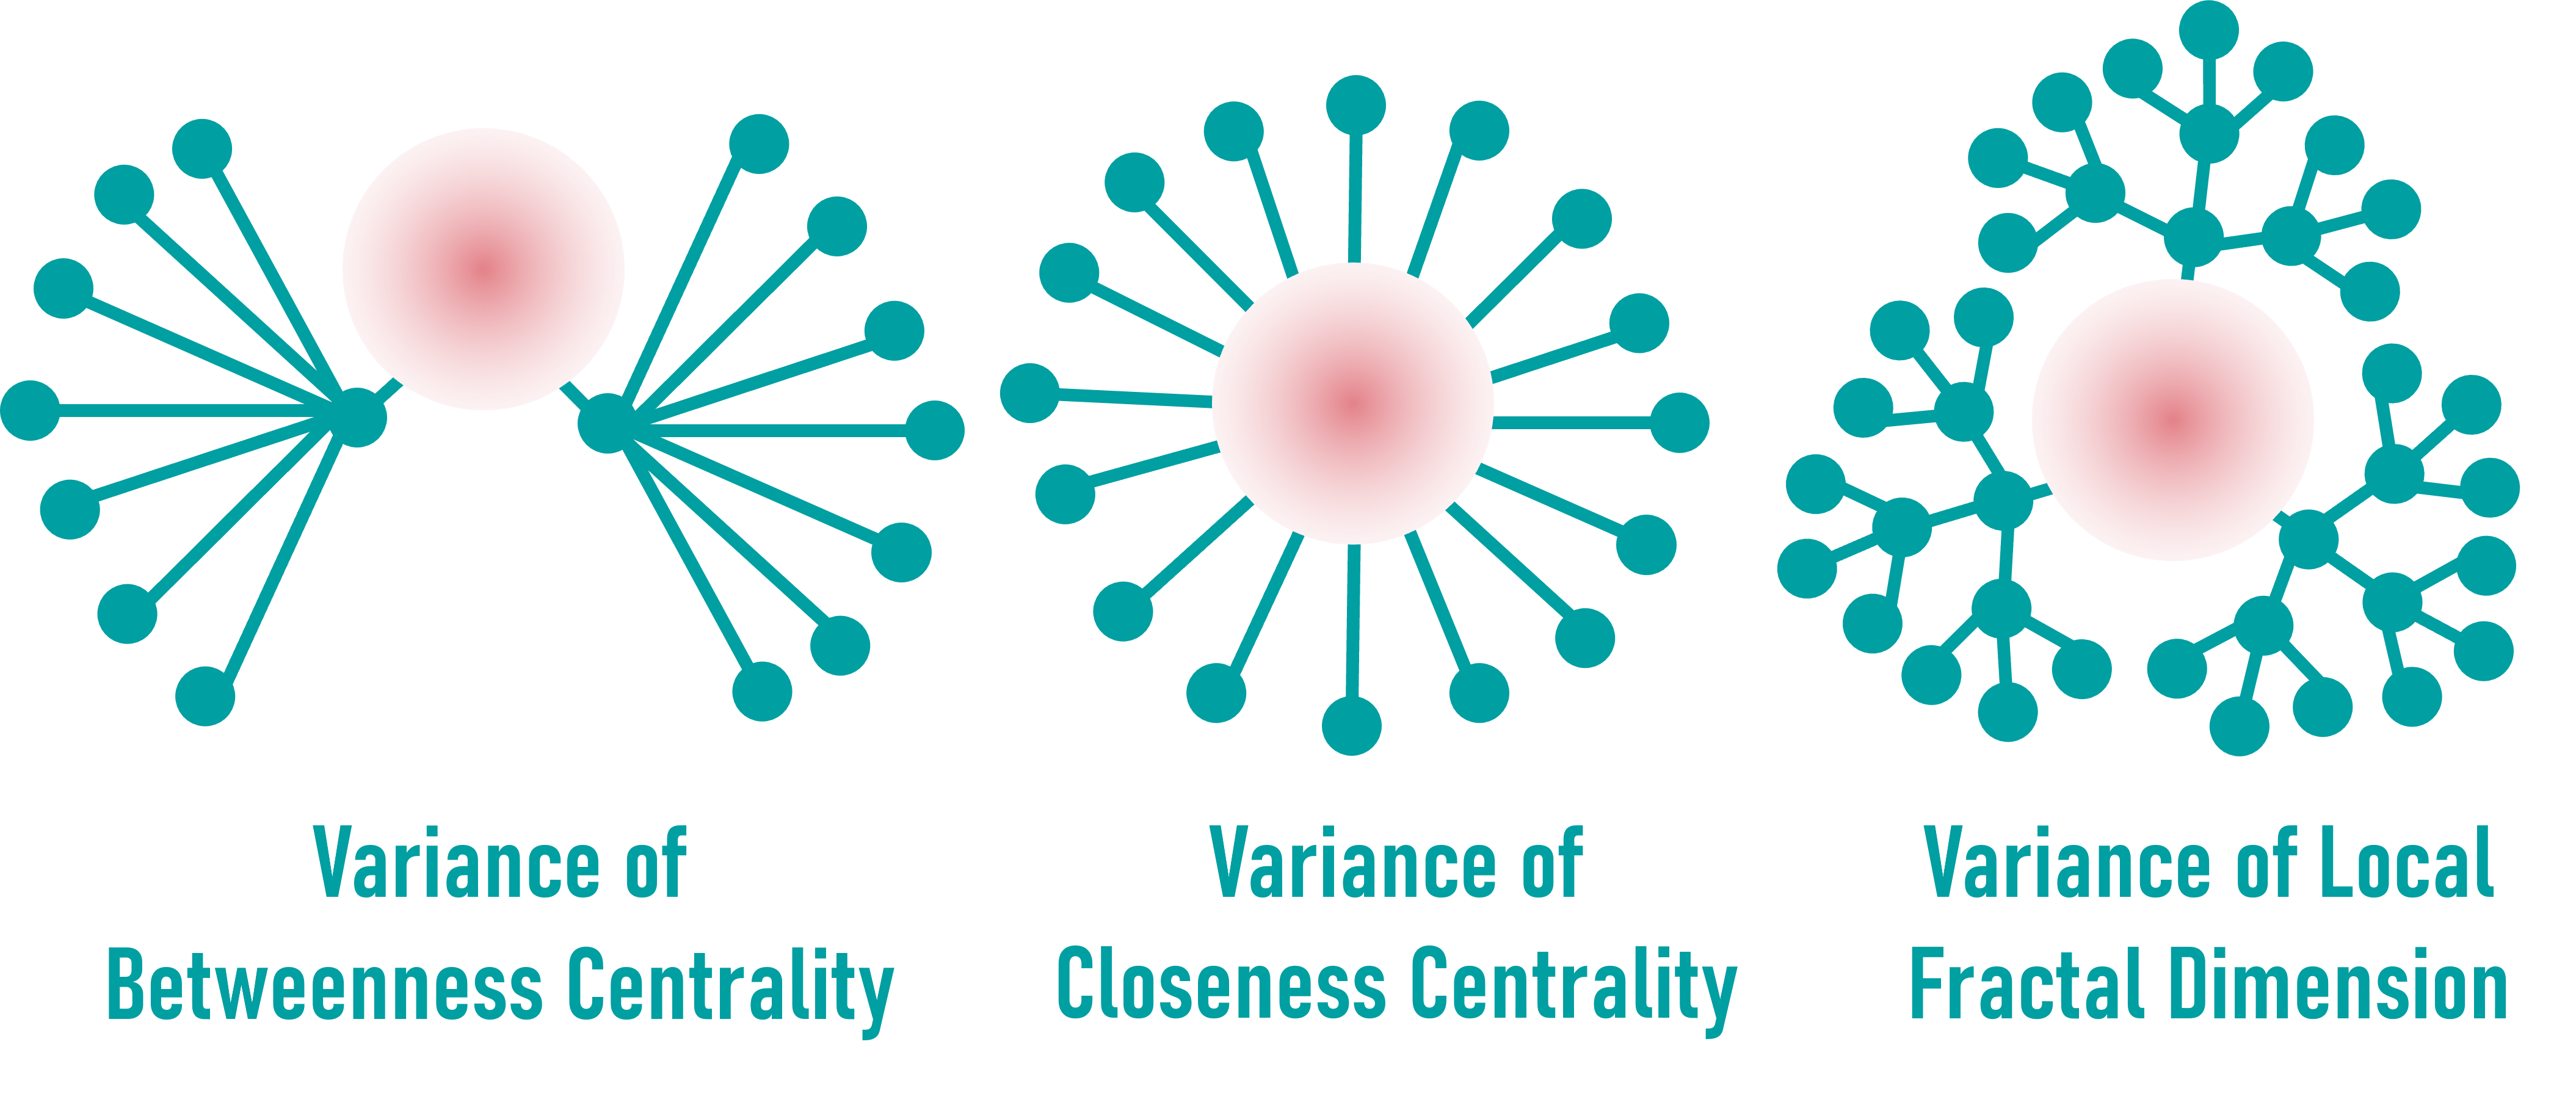
Variance of Centrality & Fractality Metrics
These metrics evaluate how stable a node’s topology is under random network rewiring.
Variance of Betweenness, Closeness (see tabular data), and Local Fractal Dimension (see tabular data) reveal how robust or fragile a node’s importance is in perturbed topologies.
Nodes with high variability but low connectivity may point to understudied roles.
CENTRA – Frequently Asked Questions (FAQ)
1. How is a gene included in the network?
A gene is included in the network if it appears in at least two gene sets associated with the same topic cluster. These clusters are derived by Latent Dirichlet Allocation (LDA) applied to MSigDB C2 gene sets (v2023.1.Hs). Genes are connected in topic-specific co-occurrence graphs if they frequently co-occur across multiple gene sets within the same topic.
2. Can you give examples of genes with high centrality or structural complexity metrics?
Yes. Examples include:
- GPX4: Displays exceptionally high betweenness centrality in the “Oxidative Stress, Lipid Metabolism, and Inflammation” network, highlighting its role as a topological bottleneck. In the “Neural Receptor, Synaptic Plasticity, and Neurodevelopment” network, it also shows exceedingly high eigenvector centrality, suggesting functional relevance in neural development and injury response.
- SRC: Shows prominently high eigenvector centrality in the “VEGF Signaling, Angiogenesis, and Endothelial Function” network. This indicates its placement in a densely interconnected hub, consistent with its role in growth factor signaling and vascular remodeling.
- SNAP25: Exhibits a uniquely high Local Fractal Dimension (LFD) in the “Intracellular Membrane Trafficking and Ubiquitin-Mediated Transport” network. This reflects a fractally expanding neighborhood structure, in line with its involvement in vesicle trafficking and membrane fusion.
3. How are the terms shown in the module view selected?
Enrichment terms (e.g., GO Biological Processes) are identified via over-representation analysis using g:Profiler (Kolberg et al., Nucleic Acids Research, 2023). Only the most significant terms (p-value < 0.05) are displayed. The number of terms shown can be adjusted using the dropdown menu above the table.
4. What do the module numbers represent?
Module numbers are assigned based on Louvain clustering of each topic-specific network. The numbering is sequential and reflects the internal clustering order. It has no functional hierarchy or size ranking.
5. Where can I find the references for the gene sets used?
All literature references underlying the gene sets used for network construction are summarized in the supplementary material of:
Hause et al., 2025. CENTRA: Knowledge-Based Gene Contextuality Graphs Reveal Functional Master Regulators by Centrality and Fractality. NAR Genomics and Bioinformatics. https://doi.org/10.1093/nargab/lqaf196
6. How can I get in touch or provide feedback?
For any questions or suggestions, please contact:
frank.hause@medizin.uni-halle.de
7. How should I cite CENTRA?
If CENTRA supports your research, please consider citing:
Hause et al., 2025. CENTRA: Knowledge-Based Gene Contextuality Graphs Reveal Functional Master Regulators by Centrality and Fractality. NAR Genomics and Bioinformatics. https://doi.org/10.1093/nargab/lqaf196