

NGS-info offers several R Shiny web applications to visualize and summarize different expression datasets. This includes private and public data. There is also the option to upload your own data and visualize it.

Allows you to create a heatmap based on your own data. The options are comma separated tables (csv) or tab separated (tsv) tables.
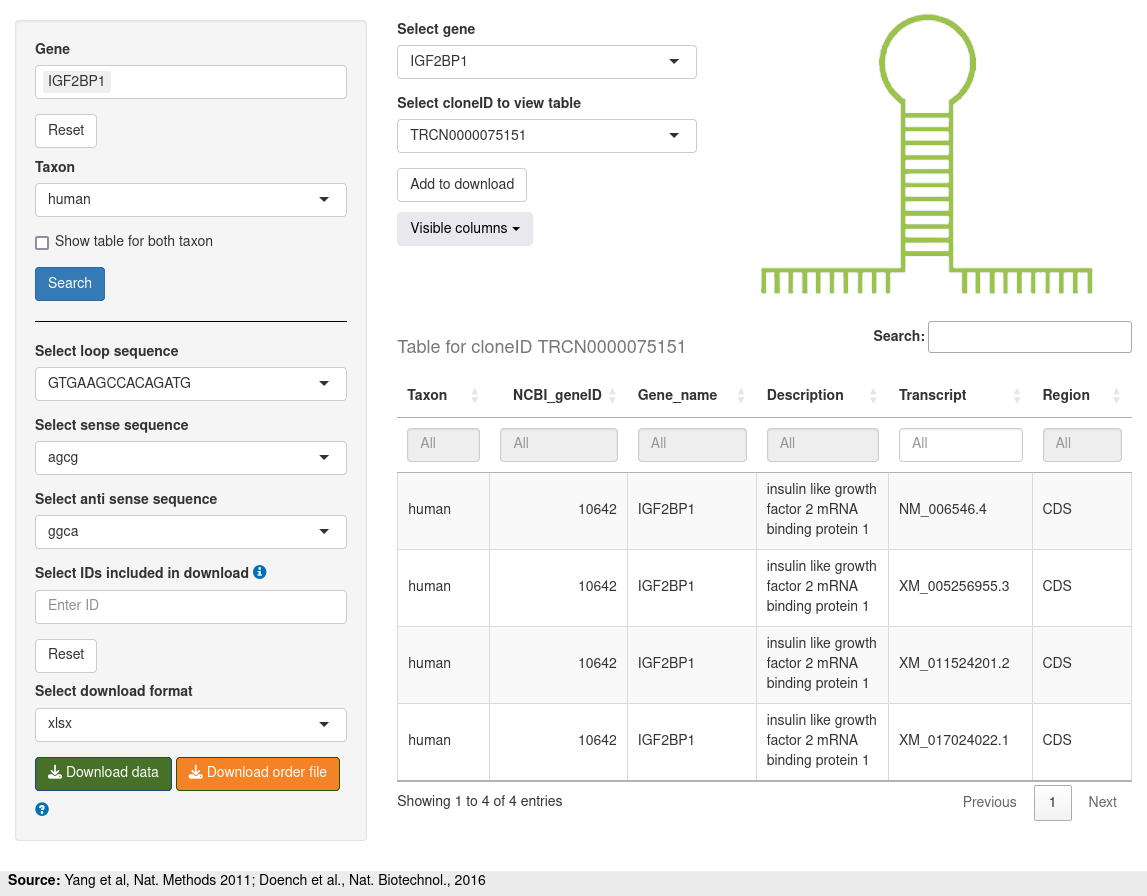
Allows you to create a shRNA based on data from broadinstitute.

CENTRA (Centrality-based Exploration of Network Topologies from Regulatory Assemblies) is a web-based application designed to support hypothesis generation about gene and protein function by analyzing their topological positioning within topic-specific biological networks.
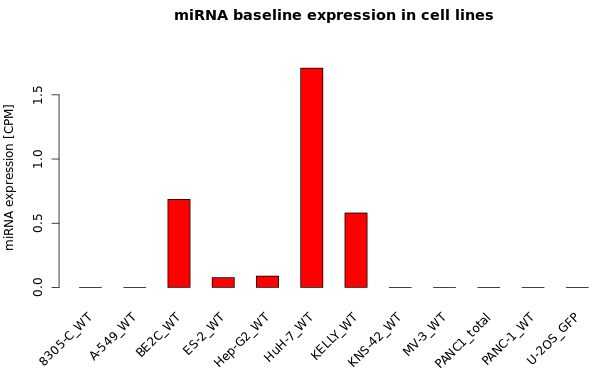
miRNA expressions can be displayed for single or multiple genes.
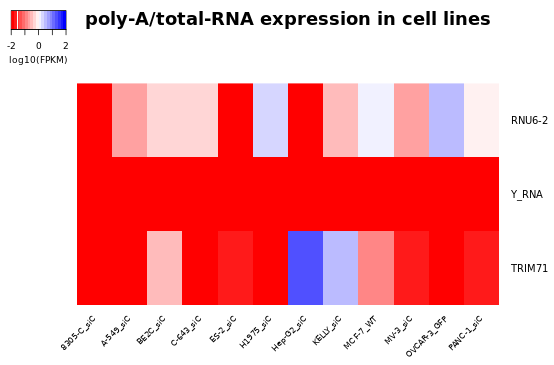
RNA expressions can be displayed for single or multiple genes.
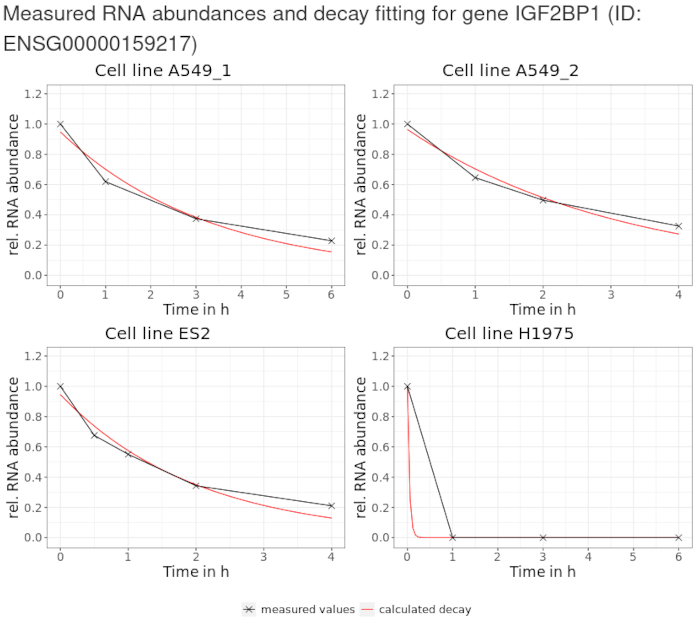
Half lives of genes in different cell lines.
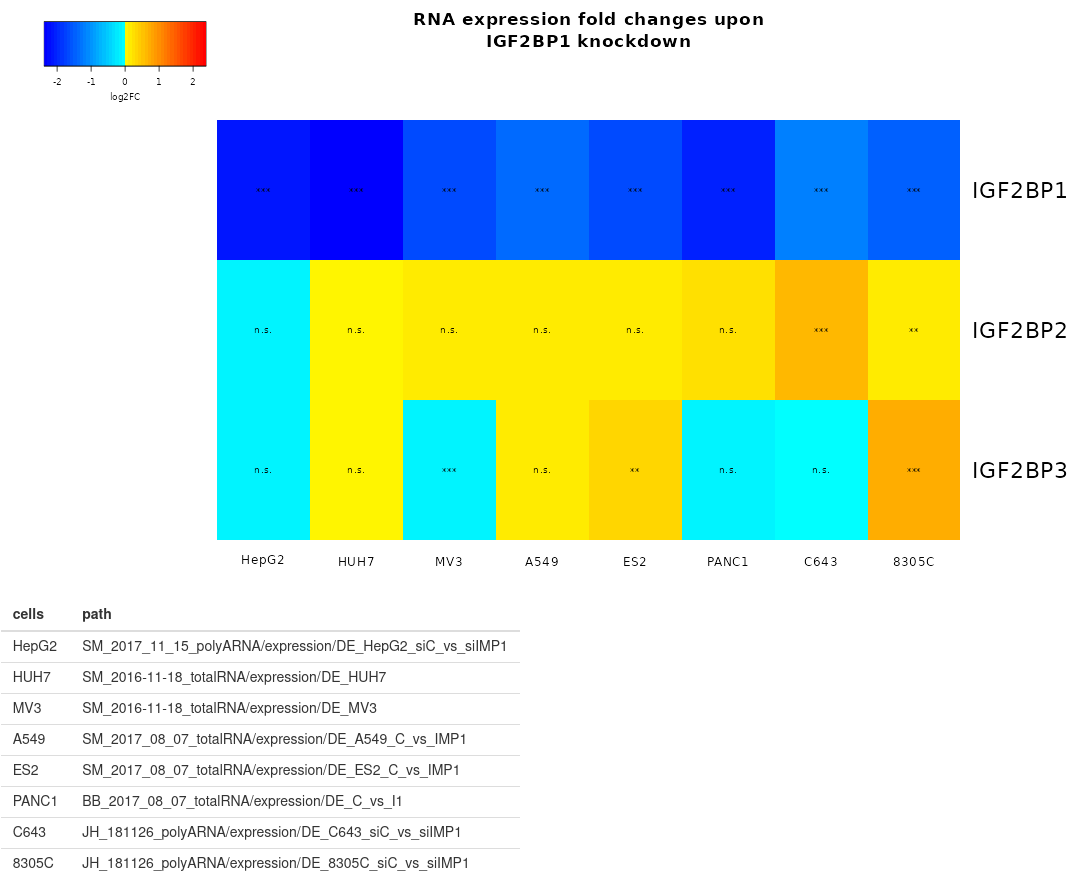
Shows the RNA expression of several genes.